


Beware: These 3 Important Indicators Are Signaling Economic Problems Ahead
The consensus is that the economy’s doing great – and will continue to do well.
Everything seems fine – right?
Well, not exactly.
I have been looking at some important – but little used – indicators that are showing very troublesome economic data.
Here are three important indicators that will throw ice on the hot economy narrative the mainstream media is pushing. . .
Right now, the yield curve is dangerously close to flattening – then soon after will invert.
Looking at the 2 n’ 10 Rule - the spread between the 2-year Treasury and the 10-year Bond - we see the spread is at the lowest it’s been since The Great Recession of 2008.
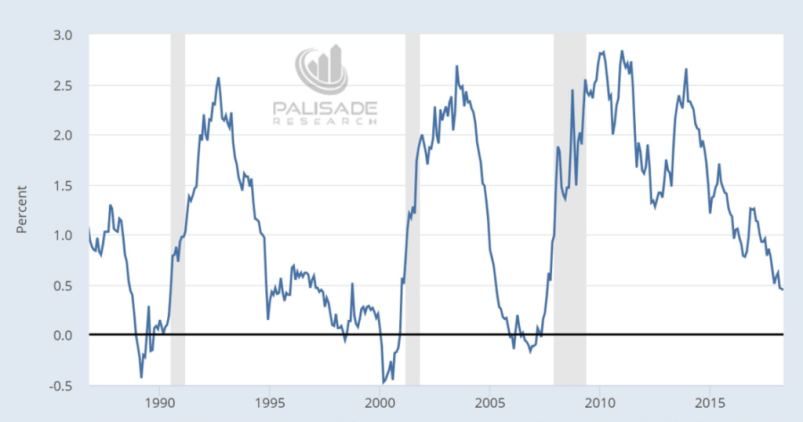
43 basis points. . . That’s it.
To put this in perspective, if the Fed hikes just two more times (which is 50 basis points) and the 10-year keeps sticking below 3%, then the yield curve will invert.
This is important because yield curve inversion – when the spread turns negative – has preceded the last seven straight recessions.
If we only look at more modern times - say the last 30 years – we can see the spread collapse negative before a recession strikes.
This 2 n’ 10 Rule is still one of the most important indicators we can use to forecast recessions. And it’s saying that the U.S. economy is more fragile than many like to admit.
There is also the cash hoarding problem going on – and that’s a bad signal of economic health.
To summarize, when things are going well in the economy – people spend more money and save less. Because they feel confident they will be able to make that money back.
But when things are uncertain and become difficult - people save their money. They will put off dining out and buying things they wanted and instead keep money in their bank account for a ‘rainy day’.
Today, Americans are saving at the highest levels since the 1991 recession. They are skittish about the future.
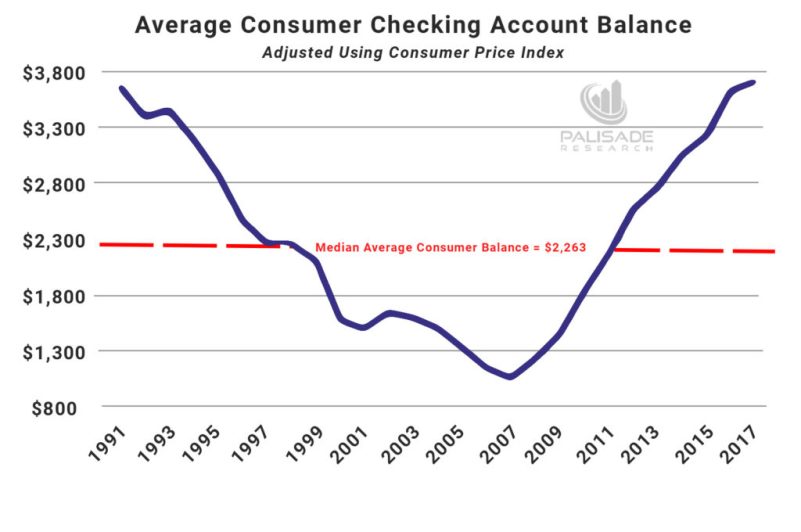
“The average checking account customer has more than $3,700 stashed away. The median amount in checking accounts since 1991 is $2,263… Anything lower than this signifies the economy is doing well… Anything above this indicates the economy is not doing well.”
This problem coincides with soaring credit card debt. And what that means is Americans would rather go into debt and finance their consumption while paying some interest instead of spending all their money upfront.
They’re opting to keep their checking accounts full incase they will need cash - not credit – immediately in the future.
That doesn’t sound like confidence – does it?
Finally, and most importantly, another situation signaling trouble ahead is a little-followed indicator - but is eerily accurate. . .
The South-Korean Export Growth (SKEG) Indicator. . .
Many wouldn’t have guessed that South Korean exports are a great leading indicator of global corporate earnings (EPS).
But historically – it is.
And right now, the SKEG indicator just turned negative.
That means so will global corporate earnings.
Just look at the 25-year correlation between the two. . .
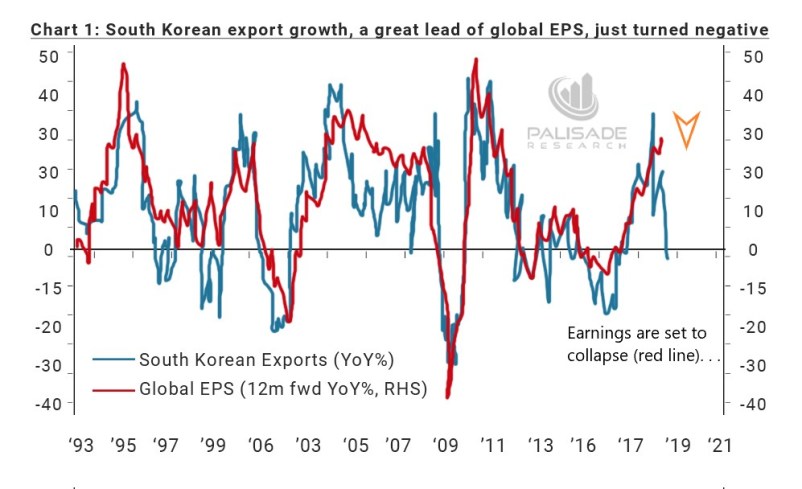
I should also remind you that the last time the SKEG indicator dropped this steeply negative was around the time China devalued their currency - the Yuan - in January 2016. Sending global markets spiraling and causing the Fed to tone back their hawkish attitude.
Also, gold ended the multi-year bear market it was in and rallied over $300 during the next few months.
If the SKEG indicator continues its accuracy – as it always has if you study the chart above – then we can forget about the mainstream media’s view of soaring earnings in the coming months.
Instead, I expect earnings to underperform over the next 12 months.
So, even with the flattening yield curve, a cash hoarding problem, and South Korean Export Growth signaling problems ahead – the Fed continues to tighten credit.
These are some widening cracks in the global growth story.
One of these cracks isn’t anything to shout “WATCH OUT” over – but three of them is worrying.
If history is any indicator – there is a high chance of big problems ahead. . .